Interactive Map of BC Carbon
| with | Tyee Solutions Society |
| and | Christopher Pollon |
| status | published |
| as of | July 2012 |
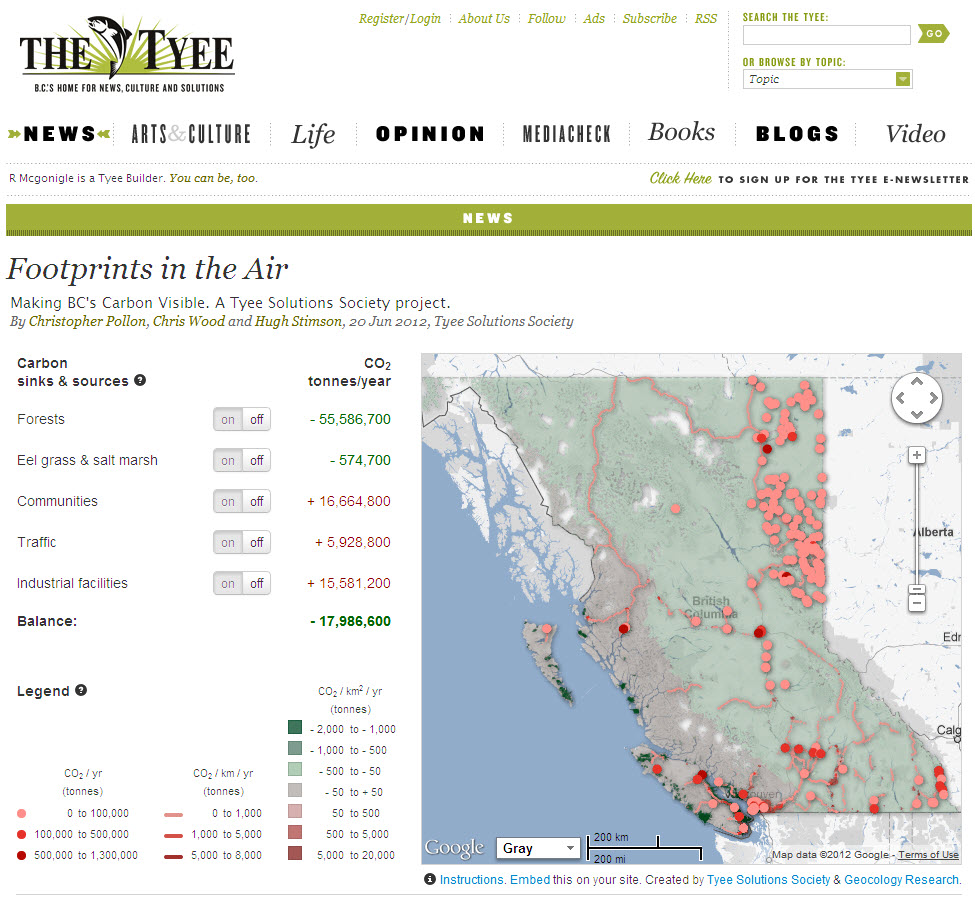
We joined forces with investigative reporters from Tyee Solutions Society to acquire data on sinks and sources of atmospheric carbon in BC, and build it into an interactive web map and balance table for exploring our provincial greenhouse gas landscape.
The Tyee Solutions Society has produced a series of investigative articles on carbon in BC from an economic, enviornmental, and social perspective. They felt that what was needed to tie the stories together was a visible summary of the state of greenhouse gas flux in the province.
Working with TSS reporter Christopher Pollen we acquired and assessed the best available data sets quantifying the major sources and sinks. We used data from the Canadian Forest Service, the Community Energy and Emmisions Inventory, BC Marine Conservation Analysis, the Shorezone Biophysical Mapping project and the Insurance Corporation of BC. All of that data was boiled down to a standard unit for comparison — tonnes of CO2 (equivalent) emitted or sequestered per year.
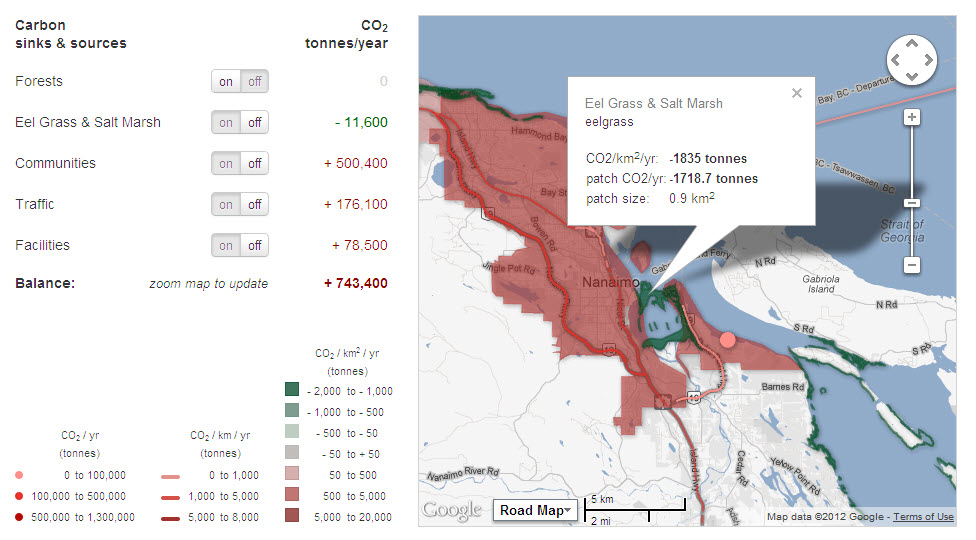
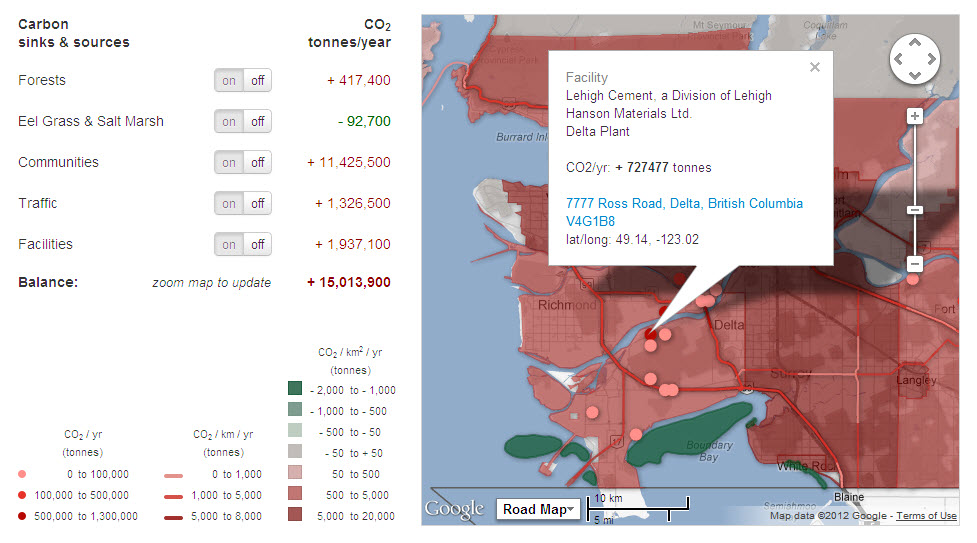
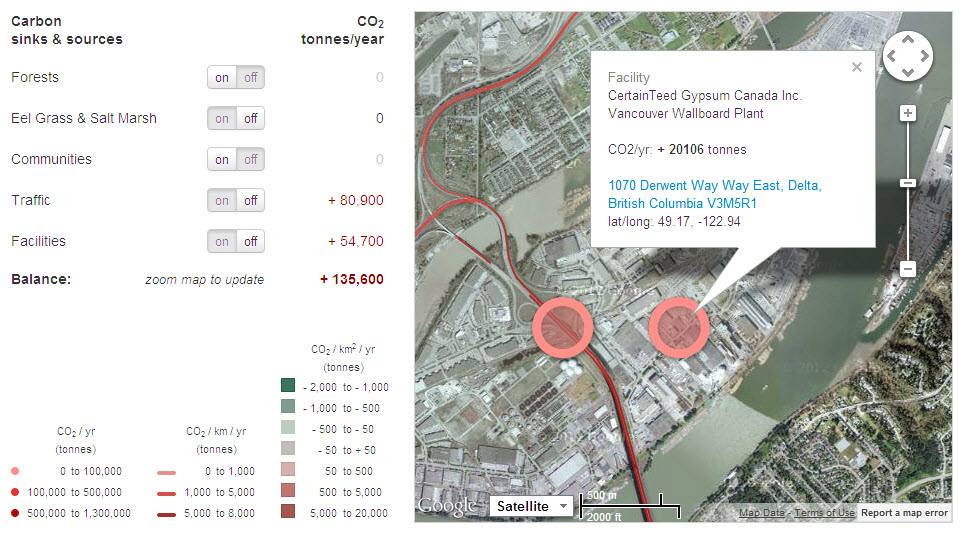
That data was built into a web map and associated table. The map shows province-wide features like forest ecozones and neighbourhood features like traffic and factories, making both a provincial and a local perspective immediately available.
The table adds up the carbon balance for the area being displayed. Buttons allow the reader to toggle data layers to isolate or add them into the map and the table. Every feature on the map can be clicked on for more information.
Along the way we learned a lot about what is known and what is not known about the state and sum of carbon emissions in BC. Three accomplanying articles have been written about those lessons, and the map and articles were published in The Tyee in July 2012.