Drift Card Map
| for | Raincoast Conservation Foundation |
| and | Georgia Straight Alliance |
| status | live |
| as of | October 2013 |
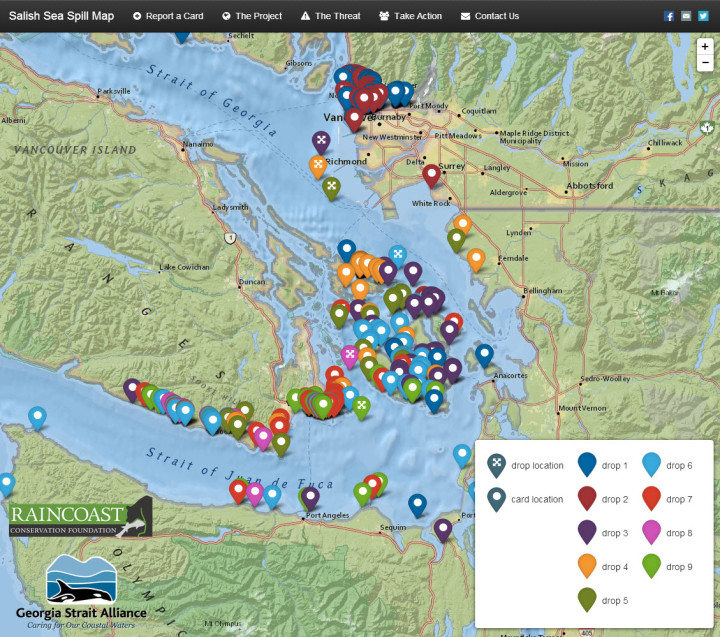
1600 wooden drift cards were dropped into the ocean at possible oil spill locations in the Salish Sea. Geocology crafted a map to make reporting a drift card sighting a smooth (and accurate!) experience.
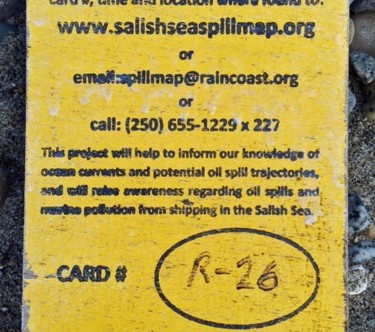
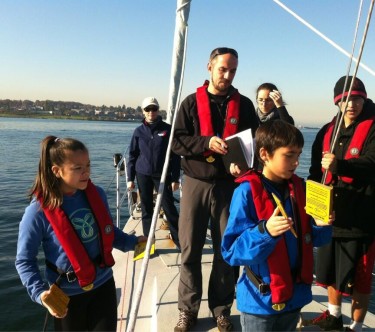
With tanker traffic possibly increasing in the Salish Sea, Raincoast Conservation Foundation and Georgia Straight Alliance decided some experimentation might be in order. They dropped hundreds of yellow wooden drift cards into the ocean, at locations where oil spills might plausibly occur. Each drift card has a URL printed on it, with a request that anyone who finds one while walking on the shoreline should go to the website and report it.
Geocology was asked to build that website. We didn’t expect many users, but we needed every single person who arrived at the site to find it highly usable. No data left behind!
We needed
- An inviting appearance.
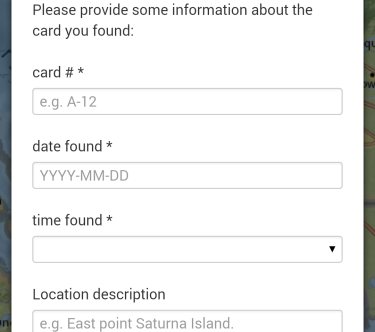
- An obvious workflow guiding users painlessly and unambiguously through each step of entering their card data.
- Validation of that data to reduce typos and misunderstandings (this data will be used for science!).
- Fall-backs in case the user did get frustrated or confused.
- Space for additional project information to provide context and acknowledge funders.
- A responsive layout that worked on desktop monitors and the smart phones of shoreline strollers alike.
- Flexible data storage to allow Raincoast and GSA staff to access, analyze and make maps of the resulting data.
And as a bonus we also wanted
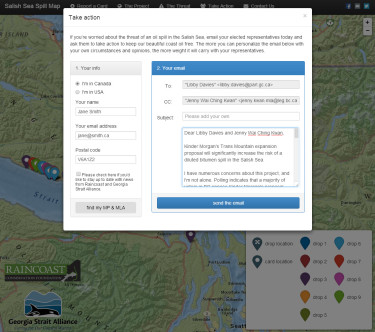
- A tool encouraging casual visitors or finished card-reporters to send emails to their political representatives, following the same principles of ease and engagement.
The map would be important, but even more important would be those forms.
Technical choices
Geocology combined Leaflet.js mapping, Bootstrap user interface elements, CartoDB database, some powerful form checking tools and a lot of custom JavaScript to deliver on those goals.
Outcomes
Of the many hundreds of cards that were dropped into the ocean, almost one third have been reported through the map. That speaks to a combination of factors:
- A lot of people spend time on the shore of the Salish Sea.
- People really care about that shoreline.
- Our website is working.
More drops are planned for the spring of 2014, and we will also be building maps for visualizing all of that data!
