Election Results Map
| for | The Dogwood Initiative |
| status | live |
| as of | August 2015 |
An interactive map, table and chart showing the results of the 2008 and 2011 Canadian federal elections, explorable down to the poll level and aggregating up to simulate the results in the new 2015 electoral districts.
The Dogwood Initiative had an ambitious plan to unite voters around federal election candidates who would oppose tanker traffic on the coast of British Columbia. To that end they built a very snazzy website as a destination for interested citizens to learn about their local candidates’ stances and chances.
As additional context for site visitors Geocology was asked to research and build a web map displaying the results of the 2011 federal election down to the level of individual polls. There was a catch–in between 2011 and 2013 the 308 Canadian electoral districts were changed into 338 slightly different ones.
Geocology pulled together all the necessary data about Candidate’s names and party results for three elections (2008, 2011 and the 2012 byelection) and
- transposed 2008 and 2011 polls into the new 2015 ridings
- added up party results to simulate what the results would had been if the 2015 ridings were in place in 2008 and 2011
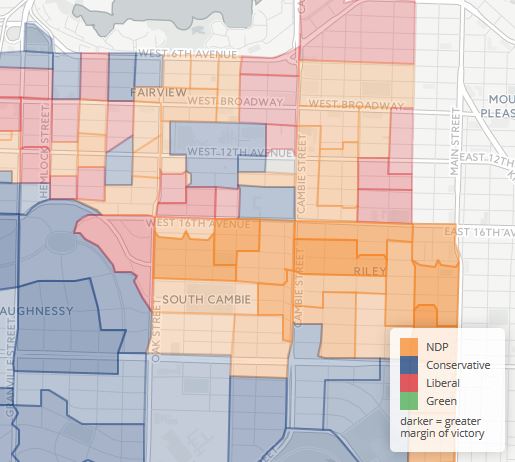
- calculated margin of victory for each poll
and built a map showing
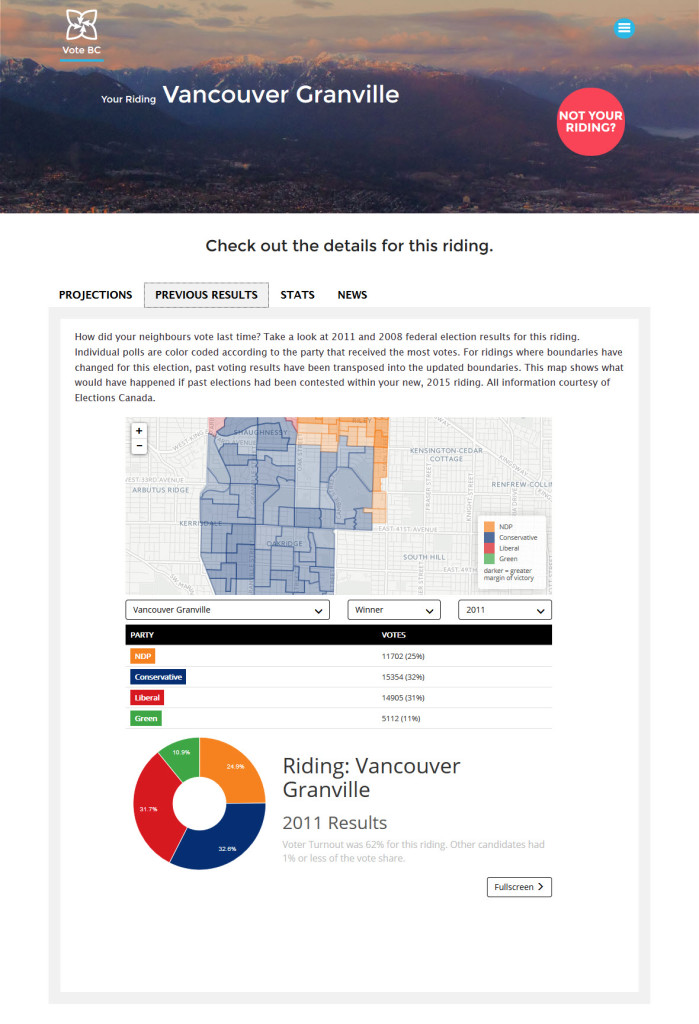
- the simulated result for each riding
- the winner of each poll
- the party results for all parties in each poll
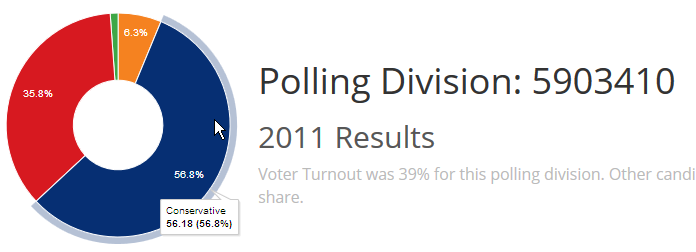
- an attached table showing the names and votes for each candidate for each poll
- a pie chart, because pie charts are awesome.
The map was hosted directly on Github and embedded in the www.votebc.ca site. And it seems to have worked.